Life insurance is often one of our largest assets. Yet, it is commonly unmanaged and misunderstood. For many, life insurance is viewed as a necessary evil – an expenditure that eventually provides cash to meet estate, personal and business obligations. Worse yet, the benefits are recognized at someone’s death, and this fact alone seems to reinforce the perception of life insurance as an unpopular use of capital. The reality is that a cash value life insurance policy is usually one of the larger assets someone owns and is generally unmanaged. Positioned strategically in an investment portfolio, life insurance can balance risk and smooth returns.
Little to no thought is given to life insurance as a contingent asset class whose often sizeable death benefit impacts an investment portfolio and affects other asset classes. When investment managers analyze life insurance similarly to how they review other investments such as bonds, stocks and private equity, the influential role life insurance plays in a well-performing investment strategy is evident.
At C3 Financial Partners, we work with clients and their advisors in managing their life insurance as an important asset class.
More than Just the Expected Return at Death
Unfortunately, the investment community has traditionally positioned life insurance to only consider the expected return realized on the income tax-free death benefit when it is paid. This is computed by measuring the return of the death benefit against the premiums paid overtime. Generally, at life expectancy, most clients will realize a return from a permanent type of life insurance, such as whole life or universal life, of between 5% and 7%. This is a respectable return in the middle of the returns expected from private equity and government bonds.
An investment manager utilizing life insurance as a contingent asset class will find this traditional method incomplete and will want to take two additional steps for a complete asset class analysis as laid out by Harry Markowitz’ Modern Portfolio Theory.[1] Markowitz, in a 1952 essay, theorized that, in addition to determining an expected return, individual portfolio assets should also be analyzed for their expected risk, which is the risk of not achieving the expected return.[1] The final step Markowitz proposed is to use the asset-specific return and risk to calculate the Sharpe Ratio, the risk-adjusted return which investment managers can use to compare against other asset classes in blending assets to achieve the optimal portfolio based upon a client’s tolerance.
Expected Risk is as Important as the Expected Return
Computing the expected risk associated with obtaining the expected return from life insurance is measured by standard deviation, which is the average amount by which returns over a specific time vary from the mean. Specifically, death benefit deviation is the average amount by which the projected return on investments (“ROIs”), adjusted for their probability of occurring, vary assuming death occurred in any year.
As they are contingent upon mortality and not the markets, each projected ROI is adjusted for and multiplied by the corresponding probability of surviving to and dying at each age. A standard deviation is calculated on these probability weighted ROIs. The lower the standard deviation, the less risk there is of not obtaining the expected return.
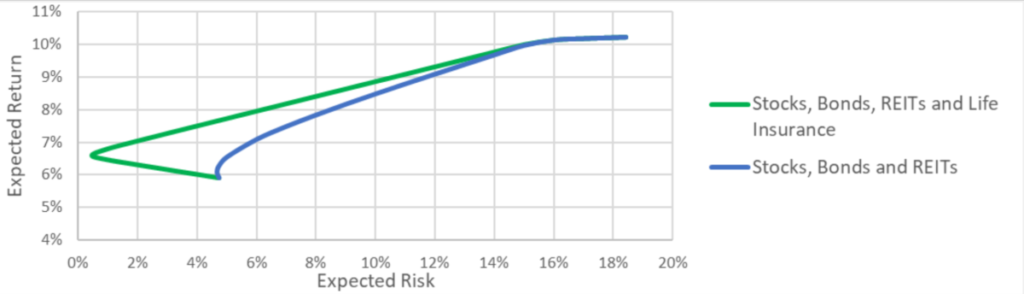
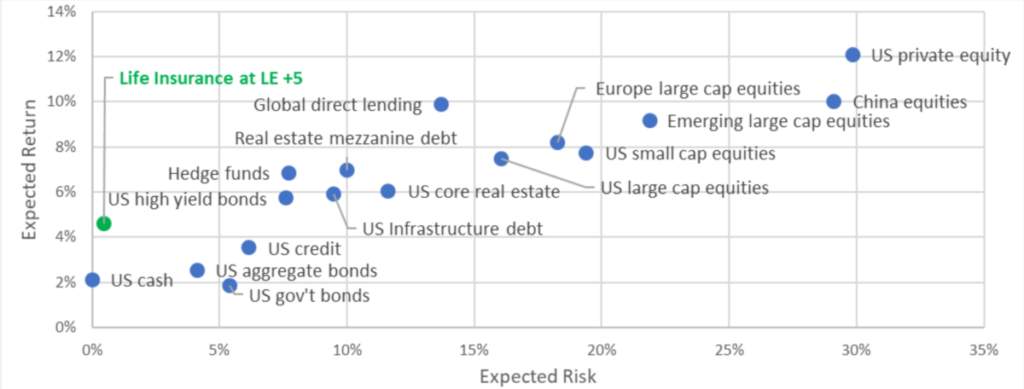
Standard deviations for life insurance among various ages, sex and health risks are commonly quite low, ranging from .15 to around 1.00. Conversely, the standard deviation for other assets classes is significantly higher – over 4% for bonds and over 17% for stocks. Investment managers are able to visualize this risk-return for various asset classes by plotting them on a chart where the vertical axis is the expected return and the horizontal axis is the expected risk. This ‘efficient frontier’ demonstrates the maximum return for a given risk or a minimum risk for a given return.
Sharpe Ratio
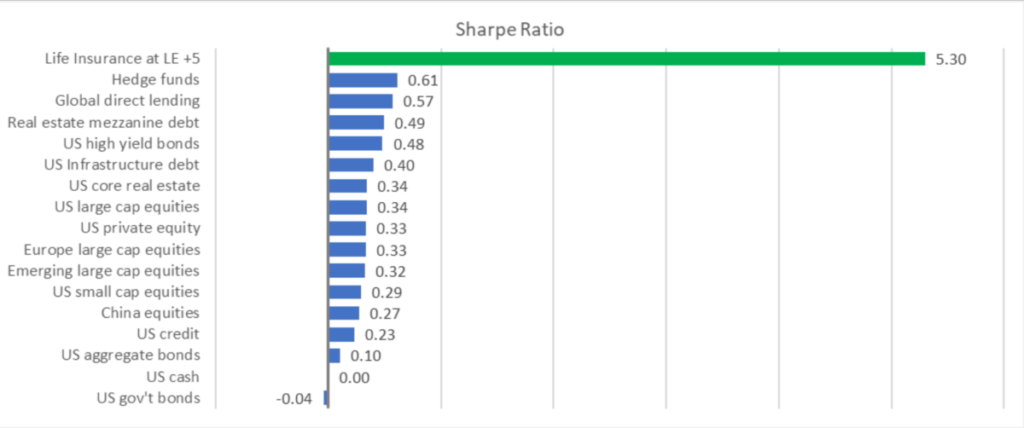
The third and final step in an asset class analysis is calculating the Sharpe Ratio, the average return earned in excess of the risk-free rate per unit of volatility or total risk.[3] Usually, any Sharpe ratio greater than 1.0 is considered acceptable to good by investors. A ratio higher than 2.0 is rated as very good. A ratio of 3.0 or higher is considered excellent.
The formula for the Sharpe Ratio subtracts the risk-free rate from the expected return of the portfolio and then divides the result by the standard deviation of the portfolio’s expected risk. The risk-free rate represents the interest an investor would expect from an absolutely risk-free investment over a specified period of time, such as cash or U.S. government bonds.
For example, cash is expected to grow at roughly 2.1% over the next twenty-five years.[4] If the expected return from life insurance is 6% and the standard deviation is .40%, then the Sharpe Ratio is 9.75, an excellent rating. In comparison, Sharpe Ratios for most other asset classes are commonly found to be under .50 and, on their own, not considered good risks.
Balancing a Portfolio
Equipped with Sharpe Ratios for various asset classes, investment managers are able to mix a number of asset classes to achieve a blended Sharpe Ratio which matches the expectations for return and risk. When an investor is expecting a significant sum of death benefit and life insurance has a high Sharpe Ratio, life insurance is the ideal contingent asset class to use as a foundation for mixing in other investments.
An investment manager may use the low risk of life insurance’s expected return to hedge against riskier asset classes such as REITs or foreign equities. In practice, life insurance is used to reduce risk and increase risk-adjusted return in a portfolio, which is especially desired for portfolios held for wealth transfer.
Speaking the Same Language
A life insurance policy’s death benefit has a meaningful impact on a client’s wealth and should be positioned as such in an investment portfolio. In working with a client’s advisors, C3 Financial Partners is able to apply the criteria and methodology of Modern Portfolio Theory to life insurance and position life insurance in the same manner as other asset classes. We help our clients gain clarity in their goals and objectives, confidence that they are making the right decisions, and coordinating with our clients’ other advisors.
[1] Judas, J. C., & Fontanini, M. (2020). Life Insurance: A Valuable Contingent Asset Class? Trusts & Estates, 159(8), 34–38.
[2] Markowitz, Harry M. (1952). Portfolio Selection. Journal of Finance 7.
[3] Sharpe, William F. (Fall 1994). The Journal of Portfolio Management.
[4] The 2.1% risk-free rate is based on BlackRock’s Capital Market Assumptions for cash over the next 25 years as of April 2020, www.blackrock.com/institutions/en-zz/insights/charts/capital-market-assumptions.